PC Engine Fan Magazine Data CollectionAbout PC Engine Fan PC Engine Fan was a Japanese monthly magazine published by Tokuma Shoten Intermedia from December 1988 to October 1996, dedicated, as you might gather from the name, to all things PC-Engine. Each month featured extensive coverage of freshly released and upcoming games, cheat codes and game guides, prize giveaways, reader-submitted reviews and letters to the editor, game sales charts, and usually a lot of discussion of vaguely game-adjacent topics like anime and voice actors to fill out the page count. PC Engine Fan was just one of several major PC-Engine–related magazines, such as Shougakukan's Gekkan PC Engine and Kadokawa Shoten's Marukatsu PC Engine. However, unlike its competitors, it has the distinct advantage to the modern reader that someone has actually gone to the trouble of scanning in all the issues and making them available online, meaning it's possible to read it in its entirety without having to track down a bunch of random decades-old magazines through Japanese auction sites. Infinite thanks to Hubz for providing these scans! Since someone went to so much effort to make the magazine available, I thought it'd be nice to do something with it, so I've put together these pages to aggregate the game sales data originally published in PC Engine Fan in an organized, searchable fashion. Unfortunately, as the rest of this page is largely dedicated to explaining, much of this data defies organization. I had fun trying, though. The DatabaseThere are two components to this database: the game list and the sales charts. Game ListThe game list is a sortable index of games and their chart scores. It can be used to view only games released during a particular period, or to filter sales data to a certain time span, and in fact it's highly advisable that you do this due to changes in the magazine's methodology over time (see the "Problems" section below). Each game's entry includes a breakdown of its appearances in the sales charts, with links to the corresponding charts. As explained below, the magazine stopped listing point scores at one point before resuming later on. Games which appeared in the charts during that period have those scores listed as "???" and their overall score as "+???," since a number of games would otherwise be listed as having 0 points. If a game isn't in the database, it never appeared in a sales chart. Sales ChartsThe sales charts are more or less a recreation of the chart data from the magazine. Though the original charts only list the top 10 games, a game that was outside the top 10 in one chart but rose to within it in the next one would usually, though not always, have that previous position indicated on the chart (e.g. "#6 this month, previously #17"). In the interest of providing as much information as possible, I've added in these "implied" entries to the charts. Game titles are generally written exactly as they appeared in the magazine's charts, so Seiya Monogatari, for instance, is listed under that title only, without the Anearth Fantasy Stories subtitle. If a game's title was inconsistent across charts, I arbitrarily picked one form or another. I mostly matched the transliterated titles with those used by Redump and No-Intro, though occasionally I disagreed with them about something. Official localizations have been ignored. Reissued verisons of games are listed separately from the originals (when I noticed them, anyway). For most of the magazine's run, games were assigned sequential ranks from 1–10, even if some of them had tied points. For the last couple of years or so (and the July 1989 issue, for some reason), this was changed so that tied games were assigned the same rank. I've simply copied the ranks as they originally appeared in each issue. The magazine's charts sometimes contained errors, which range from minor typos (such as the June 1991 issue claiming that Manhole costs "65007 yen") to, in one case, listing a game with more points as having a lower rank than one with fewer (Bomberman and Sol Moonarge in the April 1995 issue's chart). I've corrected the issues that I noticed, but there are most likely more that I missed. Please let me know if you spot any errors, either on my part or the magazine's. If you'd like to play with this data beyond the capabilities I've provided, feel free to download the raw spreadsheets for the sales charts and the game database. The Sales ChartsPC Engine Fan first began publishing game sales charts from its second issue (January 1989). As the magazine ran for nearly eight years, it's little surprise that the formatting of the charts changed over time. The basic concept remained mostly the same: each issue contained a Top 10 list in which the ten best-selling games were ranked from 1 to 10 based on a "point" score. More points means the game sold more. Simple enough...you might think. The format of the sales charts went through the following major revisions in terms of the data included: January 1989–February 1991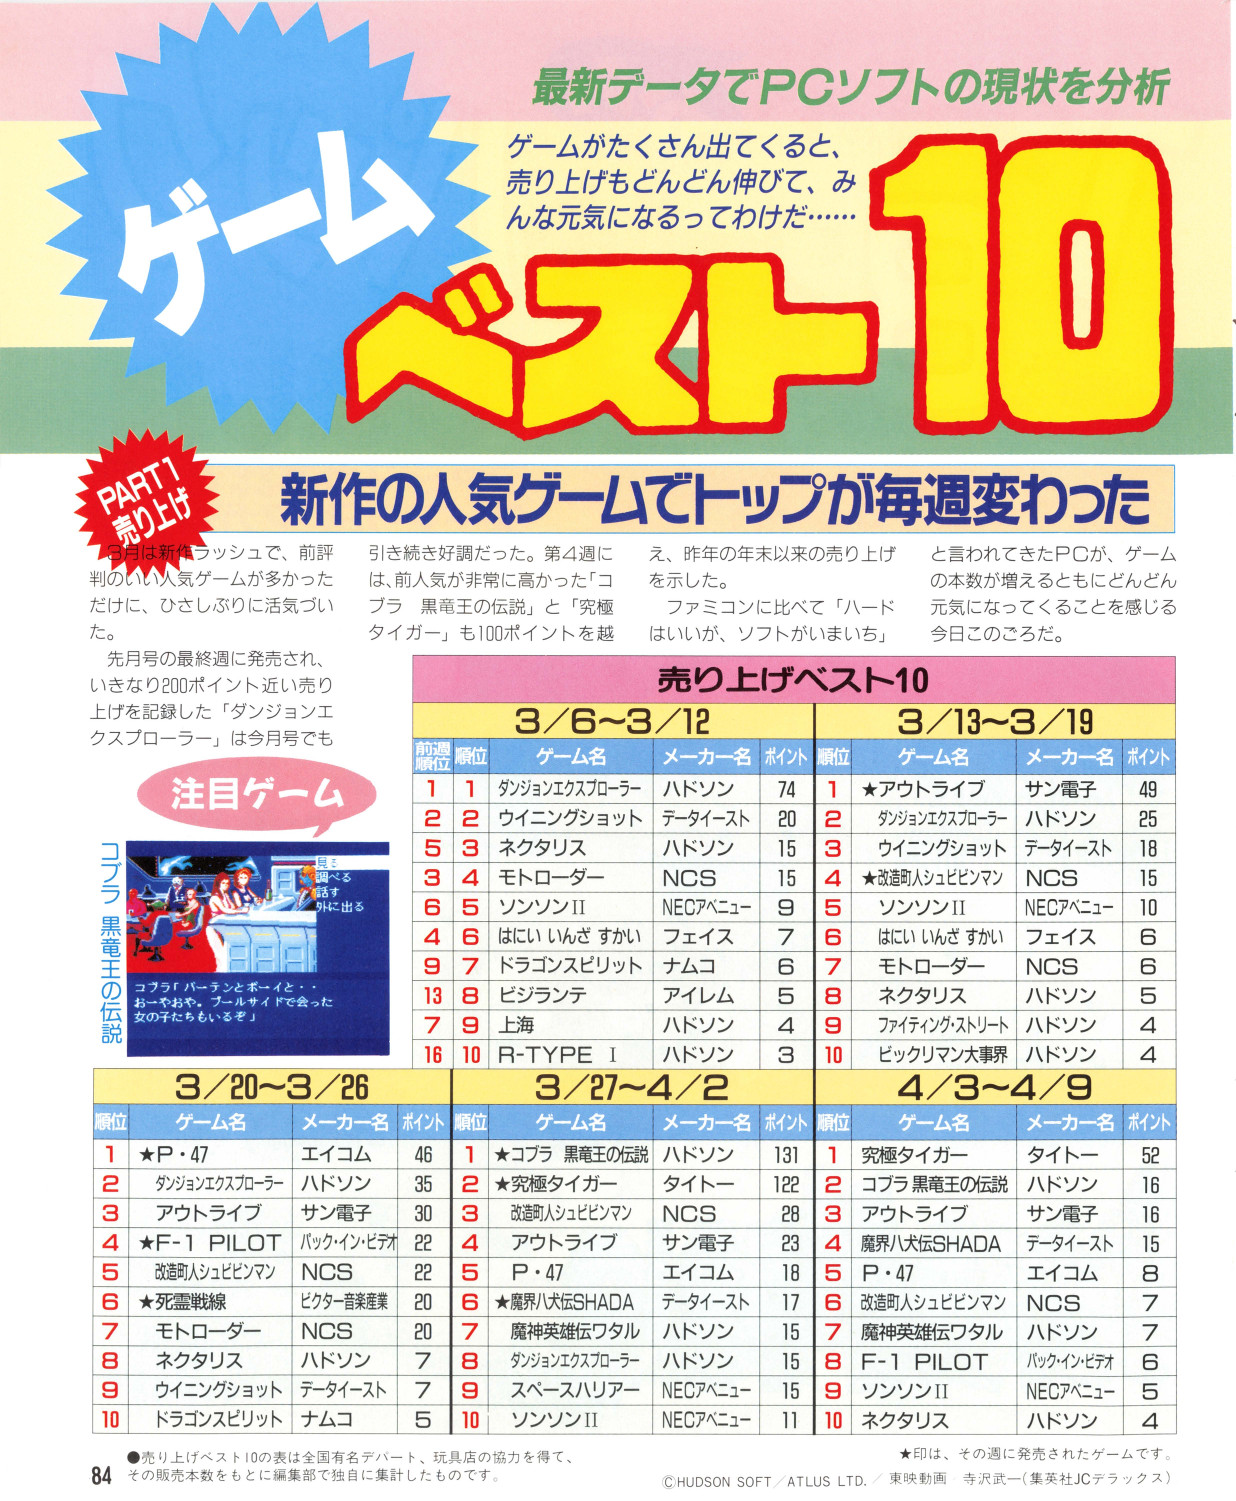 The original format. Each month's sales are presented in the ゲームベスト10 ("Game Best 10") section, eventually renamed the "PC ENGINE HIT CHART", in the form of 3–5 charts covering one week each. In later issues, the sales chart was expanded into a two-page spread, with a revamped layout that included more data about each game and a featurette which broke down which games were selling best in various regions of Japan. March 1991–December 1991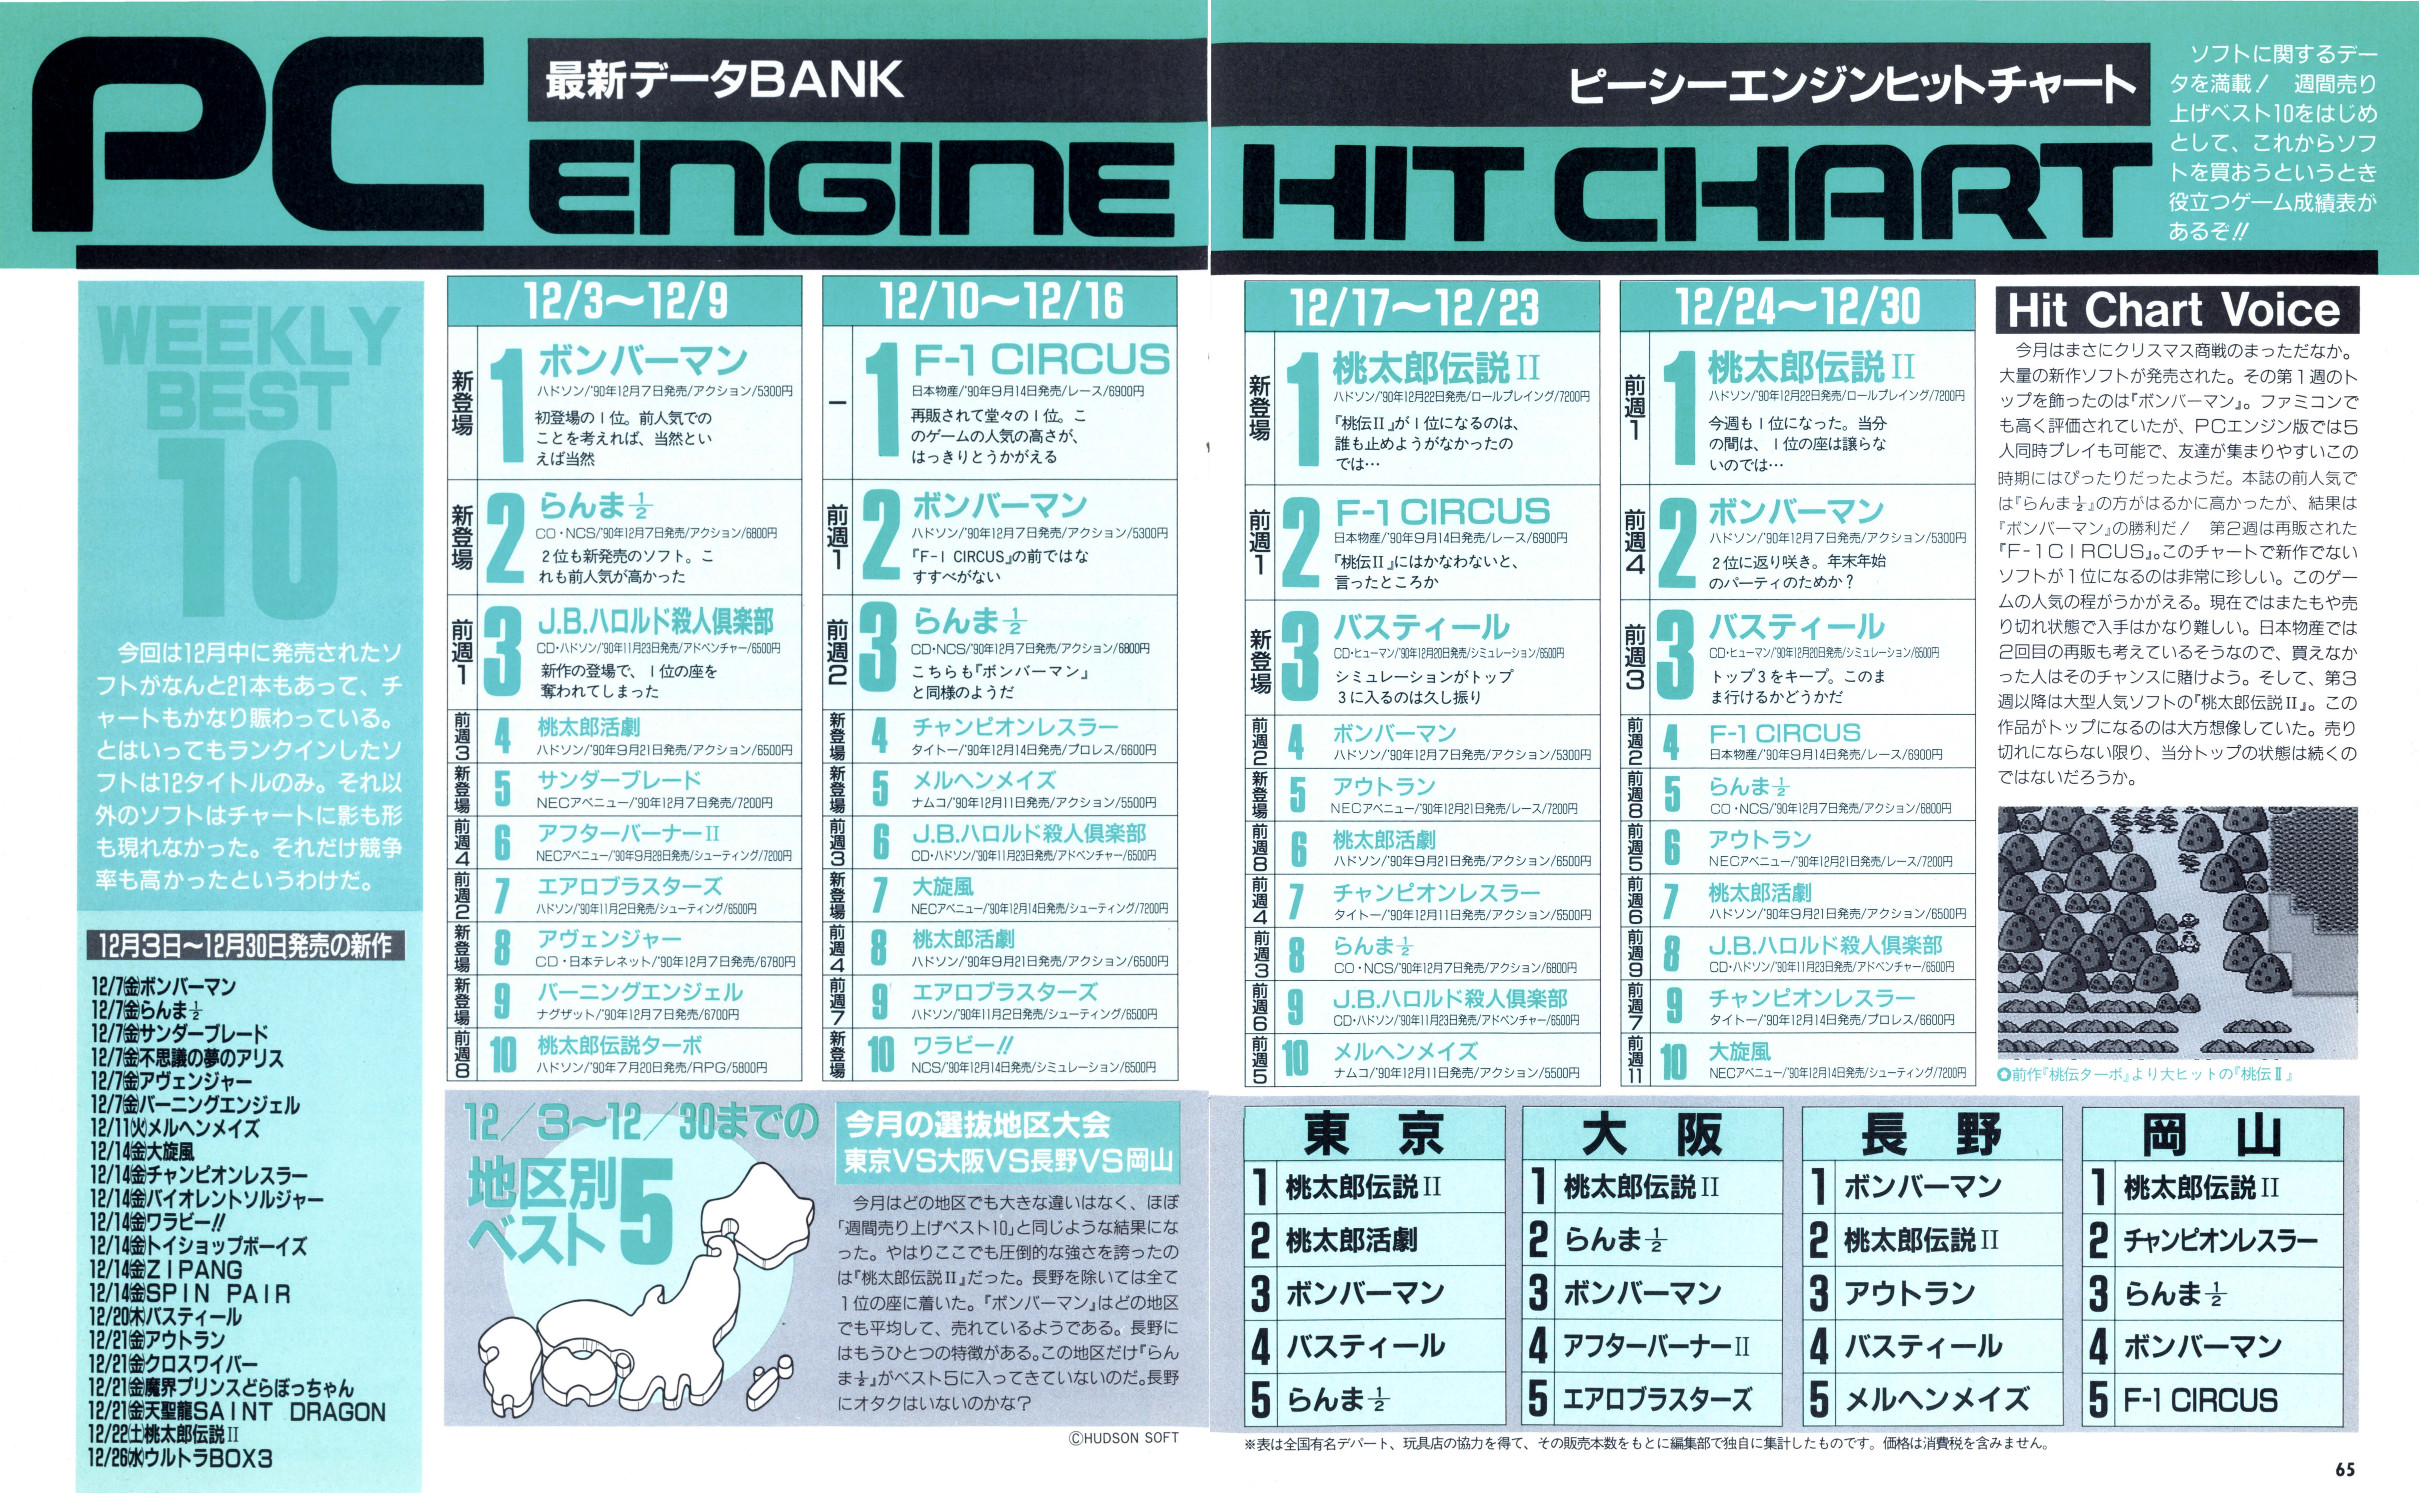 From March to December of 1991, the format of the chart remained exactly the same as before, but without apparent explanation, the magazine stopped printing point scores. This creates an unfortunate gap in the data from the late CD-ROM² era. January 1992–October 1996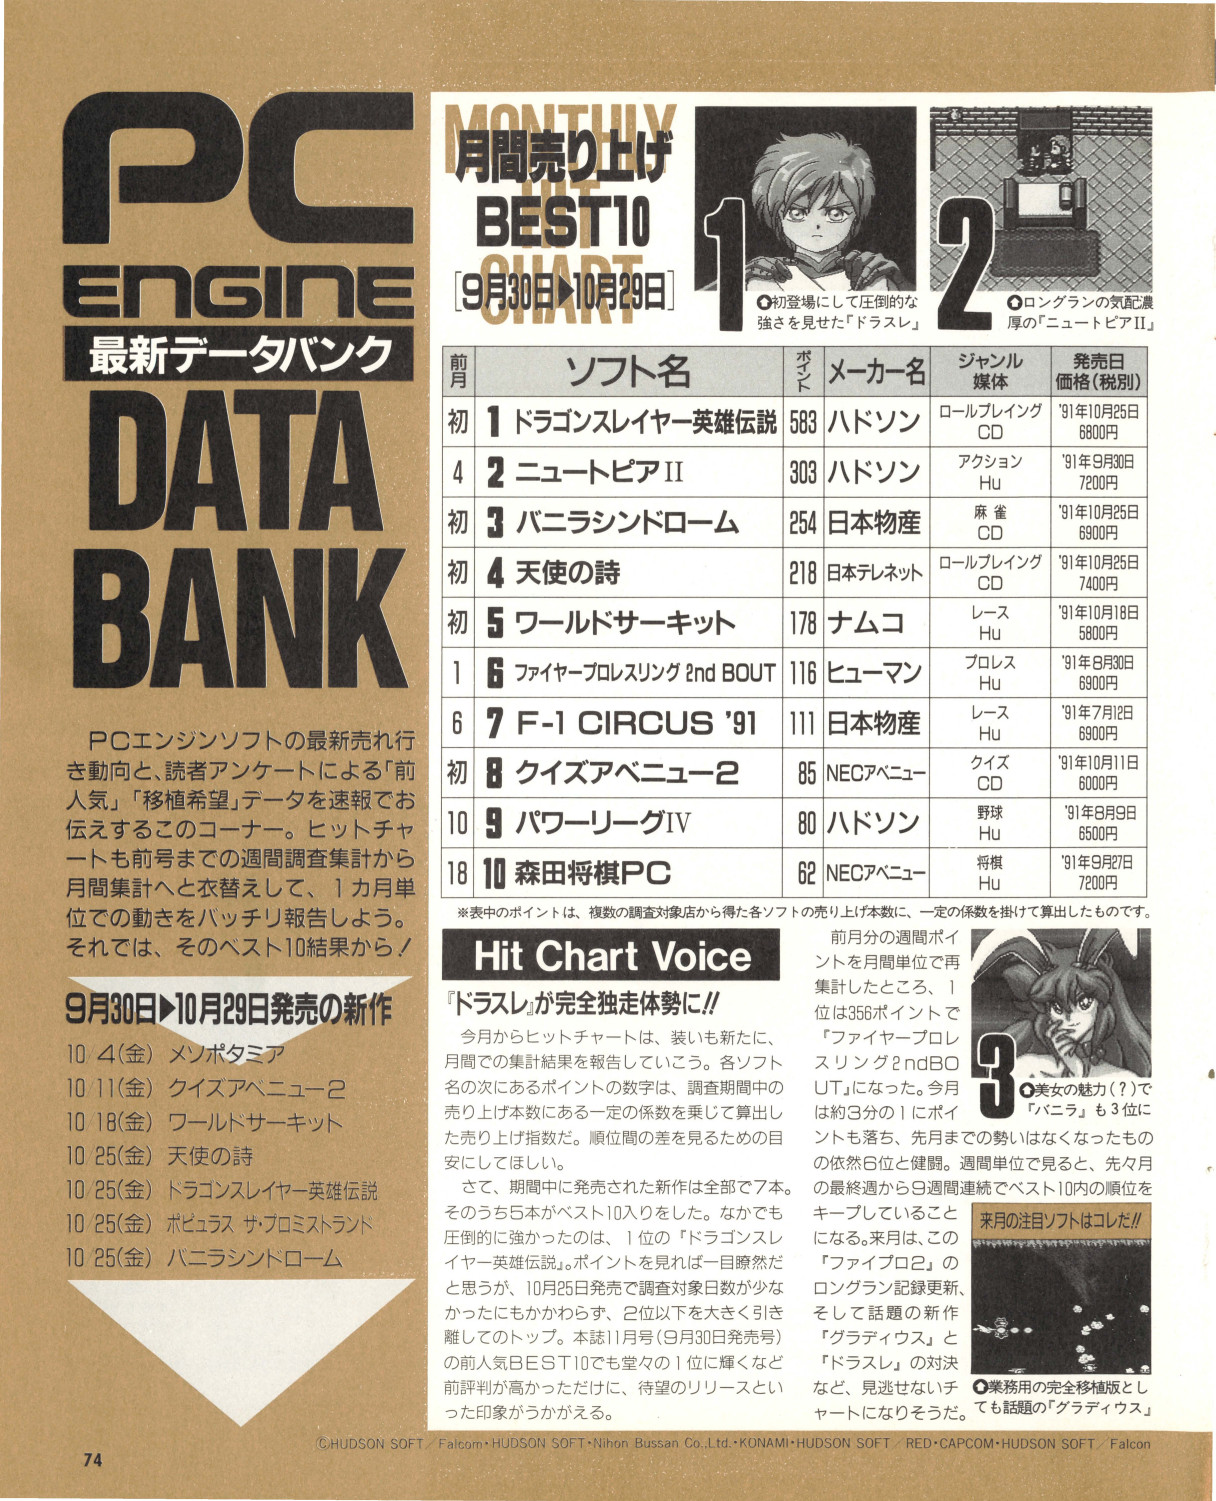 In January 1992, coinciding with the launch of the Super CD-ROM², the magazine overhauled its charts into their final form, in the newly titled "PC ENGINE DATA BANK". The sales charts returned to single-page format, and from this point on, rather than a series of weekly charts, there was just one chart that covered the whole month. Point scores returned and remained, though the scoring system almost certainly changed – see below. Once the PC-FX launched, its games also appeared here as part of a single shared chart. The PointsAs previously mentioned, the sales rankings revolve around "points" earned by each game. What exactly are these points? The magazine provided explanations in small footnotes on the chart pages. These, again, varied over time: 表は全国有名デパート、玩具店の協力を得て、その販売本数をもとに編集部で独自に集計したものです。
The charts are the result of obtaining cooperation from prominent nationwide department stores and toy stores, with the editorial department, based on the numbers of titles sold, aggregating them in a unique way. (Feb. 1991, p. 57; minor variations appeared in other issues) 表中のポイントは、複数の調査対象店から得た各ソフトの売り上げ本数に、一定の係数を掛けて算出したものです。
The points in the chart are calculated by multiplying the sales numbers for each game, obtained from multiple stores that were the targets of surveys, by a fixed factor. (Jan. 1992, p. 74) ポイントは、(株)あくとをはじめ複数の調査対象店から得た売り上げ本数に、一定の係数を掛けて算出ものです。
Points are calculated by multiplying sales numbers for each game, obtained from multiple stores such as Act (Co., Ltd.) that were the targets of surveys, by a fixed factor. (Dec. 1993, p. 70; this message returned in the Nov. 1995 issue and seems to have remained for the rest of the run) ポイントは、(株)あくと、(株)メッセサンオーをはじめ複数の調査対象店から得た売り上げ本数に、一定の係数を掛けて算出ものです。
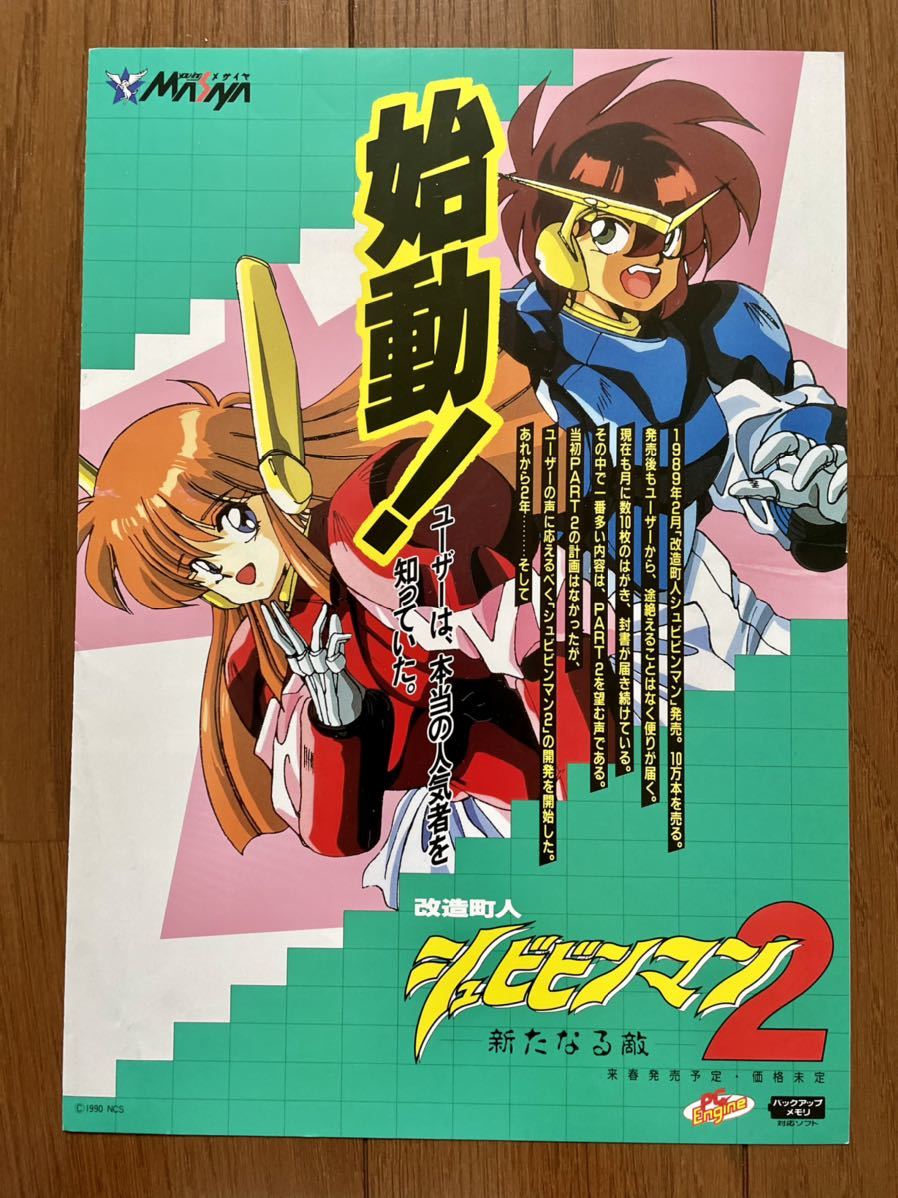
Points are calculated by multiplying sales numbers for each game, obtained from multiple stores such as Act (Co., Ltd.) and Messe Sanoh (Co., Ltd.) that were the targets of surveys, by a fixed factor. (Apr. 1994, p. 74) Basically, the points seem to be game sales numbers from a few different chain stores (probably changing over time) that have been summed up, then divided by an unknown number (probably changing over time) to yield smaller, more palatable values. If that methodology sounds opaque and dubious to you, I'm in full agreement. But this is the data we've got, so I've done my best to work with it. The ProblemsIf you have some familiarity with the PC-Engine and take a look at the top scores in the game sales database, I think you'll pretty quickly perceive that something is amiss. As much as I might like to, even I don't believe that Ginga Ojousama Densetsu Yuna 2 outsold Tengai Makyou II, or that it sold six times better than PC Genjin! Let's take a look at what might be going on with the numbers. Changing FactorsVirtually all games released during the weekly sales chart era (Jan. 1989–Dec. 1991) scored several times lower than those released in the monthly era. I'm pretty confident that the magazine began dividing the raw sales numbers by a smaller value when it switched to monthly charts, resulting in higher scores from that point on. As such, any comparison between the two eras is apples to oranges. Can we correct for this? Perhaps to some extent. Let's consider one of the few somewhat reliable data points we have for actual sales numbers. An advertising flyer for Kaizou Choujin Shubibinman 2: Aratanaru Teki claimed that the first game in the series sold 100,000 copies. The original Kaizou Choujin Shubibinman was released on March 18th, 1989, early on in the weekly chart era, and...oh, would you look at that, it scored exactly 100 points. 100,000 divided by 100 yields a nice, neat divisor of 1,000 (ignoring the fact that it's extremely unlikely the magazine's surveys collected 100% of sales numbers). The idea that the weekly-era chart scores are more or less the raw sales numbers divided by 1,000 does seem to be borne out by what little other data is available. Japanese Wikipedia currently claims (citing no source) that PC Genjin sold 700,000 units, and it scored 757 points in PC Engine Fan. However, it's clear that even if this is correct, it was no longer the case during the monthly chart era. The overall highest-scoring game was Tengai Makyou: Fuuun Kabuki-den with 5,043 points, which if multiplied by 1,000 would mean the game sold over 5 million copies. Considering that only about 2 million CD-ROM² units of any kind were ever sold, this is very obviously wrong. Japanese Wikipedia also states, once again with no source, that Tengai Makyou II sold 500,000 copies. If we believe that, and divide 500,000 by that game's 3,915 points, we get a factor of around 127. So if that's all correct, it suggests that if we multiply the weekly-era scores by (1000 / 127 = ~7.874), we can "correct" them to be comparable to the monthly era (circa 1992, anyway). If we do so with PC Genjin's 757 points, we get 5,960, which would score it above even Tengai Makyou: Fuuun Kabuki-den – a plausible result if we assume Wikipedia is correct in claiming that PC Genjin was the bestselling HuCard game of all time. Except then you notice Super Momotarou Dentetsu earned 1,521 points during the weekly era across a bajillion chart appearances, meaning its "corrected" score would be more than double that at 11,976, and realize that somebody (probably everybody) has gotten something wrong here. Let's confuse the issue even more! The November 1993 issue has a special feature in commemoration of the magazine's five-year anniversary on pages 16–21. As part of a timeline of significant PC-Engine events, it includes some data on game sales for each fiscal year (April to March of the following year). If we reference those numbers against the aggregated point data...
...well, we get some rather inconclusive results. That the gap in point data for part of 1991 makes it impossible to analyze two of the five fiscal years doesn't help matters. It's important to keep in mind that the total point values are an undercount, since only the top 10 games for each week/month had their scores reported (which means the fewer titles that were released in a year, the more accurate that data is). Also, if the sales numbers in the chart above represent the actual number of titles that were sold (manufactured?), then they're in a different unit from the points data, which is stated to be based on sales figures from specific retailers. Therefore, the "copies per point" values above are basically a ceiling on whatever actual factor the magazine might have used for its computations. It is interesting to note that the computed factor of 1,006.528 for FY 1988 is almost dead-on with our Shubibinman approximation. This lends further credence to the idea that a factor of 1,000 was used, at least for that year's HuCard sales. I can't easily explain the huge disparity in calculated factors between HuCard and CD sales for 1988, though. It's especially puzzling because the values for other years are more or less in agreement with each other. Would the magazine really have weighted early CD sales differently from HuCard sales, making them appear larger? It's not out of the question. With the small install base at the time of the CD-ROM²'s launch (a mere 80,000 units versus 1,350,000 for the base system, according to the same article), there's a good chance that treating everything equally would have resulted in the early CD games being largely pushed out of the charts by HuCard releases – and if you're a PC-Engine magazine, you have a financial interest in convincing your readers the new system is doing well. That's a lot of speculation for some very fuzzy data, though. Changing DatasetsAs suggested by the footnotes quoted above, there's a good chance that the magazine added or removed stores from its data set at various points. Assuming everything else remained constant, this would have altered the rankings, since more stores in the sample means higher numbers. The change in footnotes suggests the magazine added retailer Messe Sanoh to its data around April 1994 and removed it around November 1995. (Perhaps not coincidentally, the suspiciously-high-scoring Yuna 2 came out in June 1995.) There is a general trend toward bigger numbers later in the magazine's run – of the 10 highest-scoring games, 7 were released in 1994 or later – and changes in data collection seem the most likely culprit. Such shifts may be the reason that, for instance, Tengai Makyou: Fuuun Kabuki-den scored considerably higher than its more famous and better-known predecessor Tengai Makyou II, which almost certainly sold more copies in reality. But honestly, who knows? At this point, I'm not sure even the magazine's writers did. If any shifts did occur other than the explicitly indicated Messe Sanoh example, all we can do is guess at them. Changing MethodologyAside from any underlying changes that might have been made, the switch from weekly to monthly sales charts in 1992 had the effect of decreasing the data granularity, making low-scoring titles more likely to get pushed out of the rankings by big hits. It also caused a game's release date relative to the period covered by the chart to become more important in terms of its apparent performance: a game released near the end of the month would effectively have its key initial sales period "split" across two charts, meaning a game that would have been #1 if it had been released at the start of the month might instead be #3 for its first month and #6 for the second. While the weekly charts weren't immune to this effect, their higher granularity means it was less of a factor. ConclusionsOverall, data from the weekly chart era seems to be the most reliable...maybe. To my amateur eye, it appears at least somewhat consistent with both itself and reality. However, the HuCard vs. CD sales issue discussed aboves raises serious questions about the magazine's methodology. The monthly era fares even worse; the further you go into the monthly charts and Super CD data, the more dubious things get, with any analysis increasingly devolving into reading tea leaves. And good luck if you want to compare the weekly and monthly eras with each other. In short: Don't take these numbers too seriously. They probably mean something, at least over short-term intervals, but you'll have to squint a lot. But at least now you have the necessary data to troll people by claiming that Galaxy Fraulein Yuna 2 is the #2 PC-Engine game of all time, selling almost five times as many copies as Rondo of Blood. And by "you," I of course mean me. Mission accomplished. |
| ||||||||||||||||||||||||||||||||||||||||||||||||||||||||||||||||||||||||||||||||||||||||||||||||||||||||||||||||||||||||||||||||||||||||||||||||||||||||||||||||||||||||||||||||||||||||||||||||||||||||||||||||||||||||||||||||||||||||||||||||||||||||||||||||


